excel曲线拟合怎么弄
2017-01-13 09:09:15
来源:
电脑软硬件应用网
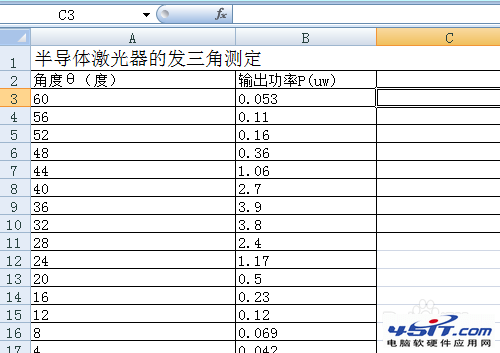
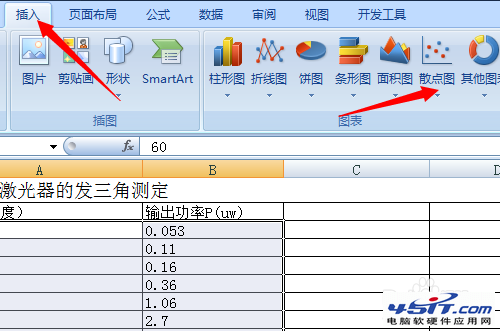
把实验数据输入excel中,两个变量的最好做成两个竖排。
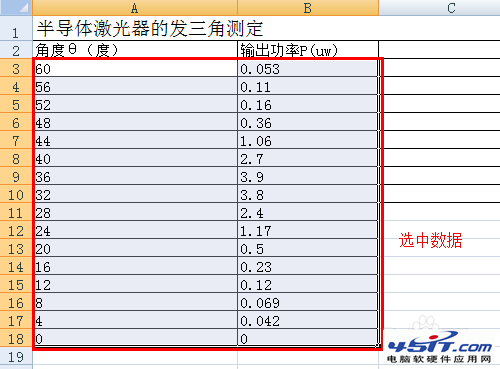
选中所有数据,注意不要把文字也选上了。
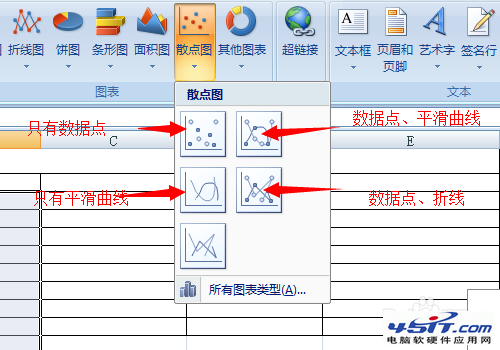
在菜单栏中点“插入”,然后选择“散点图”下面的下拉菜单。
从菜单中选择自己需要的类型,一般选择既有数据点,又有平滑曲线的散点图。
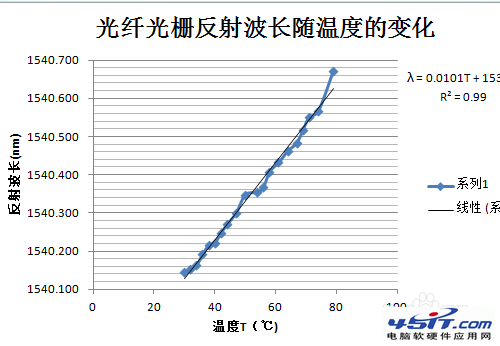
发现生成了图形,但是有一些问题,比如没有坐标轴名称,没有刻度等。
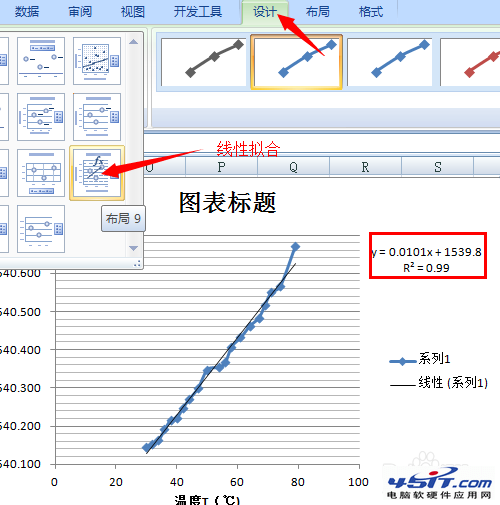
打开菜单中的设计,点图标布局中的下拉菜单。
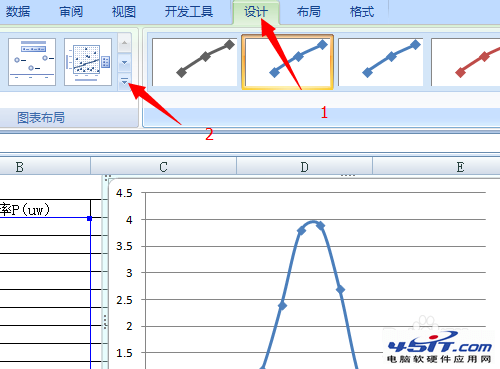
会看到有很多布局类型的图标,选择自己需要的。比如,图中选的布局是常见的有标题,坐标轴名称的。
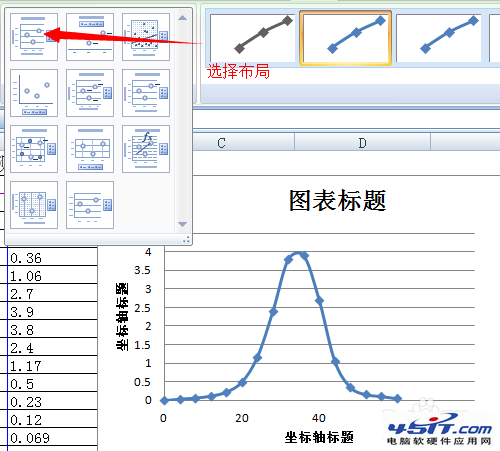
另外,如果需要线性拟合的,直接选图中所示的布局,这样会直接给出函数表达式及相对误差。
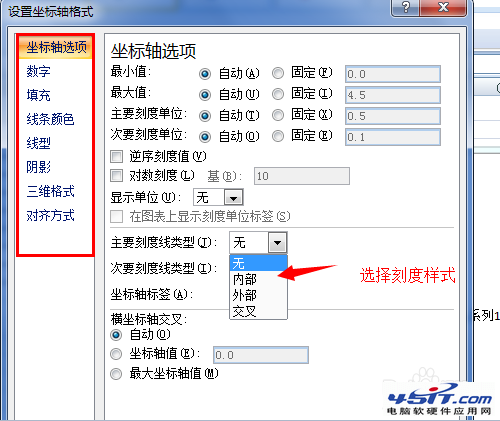
坐标轴还需要设置:用鼠标点击坐标轴附近的区域,右键,选择“设置坐标轴格式”。
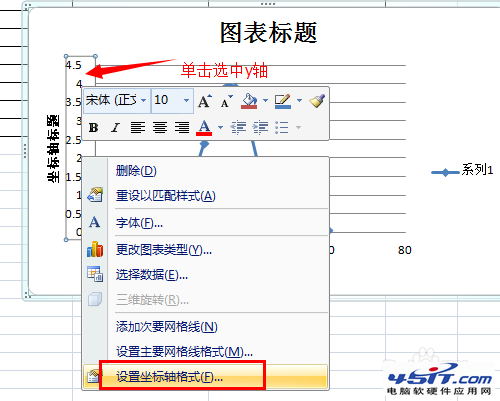
在这里可以进行详细地设置。